Journals > > Topics > Diffraction and Gratings
Diffraction and Gratings|274 Article(s)
Calculation of Coherent Optical Imaging Theory and Ringing Oscillation
Junchang Li, Qinghe Song, Jinbin Gui, and Haiting Xia
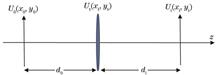
ObjectiveIn modern optical research, the electromagnetic theory of light propagation, interference, and diffraction was systematically described in M. Born and E. Wolf's Principles of Optics and Joseph W. Goodman's Introduction to Fourier Optics. The coherent optical imaging theories in the two classic works are widely cited by contemporary scientists and technological workers. However, both theories are obtained in approximate conditions. The calculation formulas given in Principles of Optics are derived based on assuming the existence of an "isoplanatic region" in the image plane. The derived formula introduces a pupil function that is only related to the optical system aberration and the exit pupil does not provide a specific expression for the pupil function, which cannot be employed for practical calculations. The calculation formula given in Introduction to Fourier Optics can only calculate the amplitude distribution of the image field when the object size is less than 1/4 of the diameter of the incident pupil.From a mathematical perspective, the formulas derived from the two optical masterpieces have the same form, and coherent optical imaging systems are both linear space-invariant systems. The physical meaning of the transfer function defined by the outgoing pupil is a filter for the ideal image spectrum.With the advancing technology, the above approximate theories are gradually unable to meet practical needs. For example, experimental observations indicate that the imaging quality varies in different regions of the image plane, and the imaging system illuminated by coherent light is not a linear space-invariant system. Additionally, in modern optical detection research, the amplitude and phase of the image field are equally important physical quantities, and the theory that can only calculate the amplitude distribution of the image field cannot meet the requirements. Therefore, it is necessary to study theories that can accurately calculate the amplitude and phase distribution of image light fields.MethodsBased on Fresnel diffraction integration, the spatial tracing of the optical wave field during the imaging of the lens imaging system is carried out, and the expression that can calculate the amplitude and phase distribution of the image light field is derived. Based on the derived formula, the shortcomings of the coherent optical imaging theory in the above-mentioned two optical masterpieces are first studied.Considering currently no reports of quantitative numerical calculations on "ringing oscillation" in coherent optical imaging, ringing oscillation is an interference that must be eliminated for the image field of digital holographic detection. To experimentally prove the formula derived by the authors and provide a theoretical basis for eliminating ringing interference, we design a microscopic digital holography system. By adopting a USAF1951 resolution plate as the object, the intensity distribution of the image field is calculated using the calculation formula given in Introduction to Fourier Optics and the formula derived by us and compared with experimental measurements. In comparative studies, special attention should be paid to whether the theoretical distribution calculation of ringing and oscillation fringes is consistent with experimental measurements.Results and DiscussionsBased on the derived formula [Eq. (6)], the coherent optical imaging system is no longer a linear space-invariant system. The research results on the coherent optical illumination imaging formula in Principles of Optics indicate that for actual optical systems, there is no "isoplanatic region" in the image field, and there is no pupil function that is independent of the object field but only related to the exit pupil and aberration of the imaging system. The calculation formula given in Introduction to Fourier Optics can only approximate the amplitude distribution of the image light field when the object size is smaller than the diameter of the incident pupil by 1/4.The comparison between theoretical calculations and experimental measurements shows that the derived Eq. (6) can more accurately calculate the distribution of ringing and oscillating fringes appearing in the image light field (Figs. 8-10).ConclusionsFormulas that can calculate the amplitude and phase of the image light field are derived by spatial tracking of the coherent optical imaging process, and the shortcomings of classical coherent optical imaging theory are discussed. An imaging experiment with a rectangular transparent hole as the object is designed to prove the correctness of the derived formula. Meanwhile, the classical imaging calculation formula and the derived formula are utilized to simulate and calculate the experimental measurement image. The research results indicate that the derived formula can not only accurately calculate the intensity image of the image light field, but also more accurately calculate the distribution of ringing oscillations. ObjectiveIn modern optical research, the electromagnetic theory of light propagation, interference, and diffraction was systematically described in M. Born and E. Wolf's Principles of Optics and Joseph W. Goodman's Introduction to Fourier Optics. The coherent optical imaging theories in the two classic works are widely cited by contemporary scientists and technological workers. However, both theories are obtained in approximate conditions. The calculation formulas given in Principles of Optics are derived based on assuming the existence of an "isoplanatic region" in the image plane. The derived formula introduces a pupil function that is only related to the optical system aberration and the exit pupil does not provide a specific expression for the pupil function, which cannot be employed for practical calculations. The calculation formula given in Introduction to Fourier Optics can only calculate the amplitude distribution of the image field when the object size is less than 1/4 of the diameter of the incident pupil.From a mathematical perspective, the formulas derived from the two optical masterpieces have the same form, and coherent optical imaging systems are both linear space-invariant systems. The physical meaning of the transfer function defined by the outgoing pupil is a filter for the ideal image spectrum.With the advancing technology, the above approximate theories are gradually unable to meet practical needs. For example, experimental observations indicate that the imaging quality varies in different regions of the image plane, and the imaging system illuminated by coherent light is not a linear space-invariant system. Additionally, in modern optical detection research, the amplitude and phase of the image field are equally important physical quantities, and the theory that can only calculate the amplitude distribution of the image field cannot meet the requirements. Therefore, it is necessary to study theories that can accurately calculate the amplitude and phase distribution of image light fields.MethodsBased on Fresnel diffraction integration, the spatial tracing of the optical wave field during the imaging of the lens imaging system is carried out, and the expression that can calculate the amplitude and phase distribution of the image light field is derived. Based on the derived formula, the shortcomings of the coherent optical imaging theory in the above-mentioned two optical masterpieces are first studied.Considering currently no reports of quantitative numerical calculations on "ringing oscillation" in coherent optical imaging, ringing oscillation is an interference that must be eliminated for the image field of digital holographic detection. To experimentally prove the formula derived by the authors and provide a theoretical basis for eliminating ringing interference, we design a microscopic digital holography system. By adopting a USAF1951 resolution plate as the object, the intensity distribution of the image field is calculated using the calculation formula given in Introduction to Fourier Optics and the formula derived by us and compared with experimental measurements. In comparative studies, special attention should be paid to whether the theoretical distribution calculation of ringing and oscillation fringes is consistent with experimental measurements.Results and DiscussionsBased on the derived formula [Eq. (6)], the coherent optical imaging system is no longer a linear space-invariant system. The research results on the coherent optical illumination imaging formula in Principles of Optics indicate that for actual optical systems, there is no "isoplanatic region" in the image field, and there is no pupil function that is independent of the object field but only related to the exit pupil and aberration of the imaging system. The calculation formula given in Introduction to Fourier Optics can only approximate the amplitude distribution of the image light field when the object size is smaller than the diameter of the incident pupil by 1/4.The comparison between theoretical calculations and experimental measurements shows that the derived Eq. (6) can more accurately calculate the distribution of ringing and oscillating fringes appearing in the image light field (Figs. 8-10).ConclusionsFormulas that can calculate the amplitude and phase of the image light field are derived by spatial tracking of the coherent optical imaging process, and the shortcomings of classical coherent optical imaging theory are discussed. An imaging experiment with a rectangular transparent hole as the object is designed to prove the correctness of the derived formula. Meanwhile, the classical imaging calculation formula and the derived formula are utilized to simulate and calculate the experimental measurement image. The research results indicate that the derived formula can not only accurately calculate the intensity image of the image light field, but also more accurately calculate the distribution of ringing oscillations.
Acta Optica Sinica
- Publication Date: Feb. 25, 2024
- Vol. 44, Issue 4, 0405001 (2024)

Focusing Optimization and Control of Cylindrical Vector Beams with Blazed Subwavelength Grating Lens
Jun Wang, Ji Xu, Sheng Li, Tiantian Chi, Han Yao, Baifu Zhang, and Ning Liu
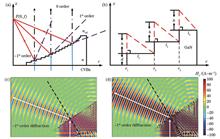
Results and discussion In the equivalent prism model, adding the blazed gratings significantly increases the energy proportion of the -1st order diffracted light, which proves the feasibility of the optimization mechanism (Fig. 1). The hollow grating lens decorated with the blazed structure can significantly increase the focal field energy with the peak value increasing to 2.91 times, while the focusing position is slightly shifted and the focusing width is broadened (Fig. 2). Under different preset focal lengths, the deflection of the beam passing through the lens varies, and the relationship between the focal field energy and the height of the blazed structure also changes. At near and medium focal lengths, the focal field energy first increases and then decreases with the height, and at far focal lengths, the focal field energy increases with the height (Fig. 3). When the number of blazed structures changes, more of them cause the diffracted beams to interact with each other, offset part of the phase difference, and reduce focal shift, with improved focusing energy efficiency (Fig. 4). The incident light distribution can also manipulate the focal field. By controlling the beam parameters to adjust the energy distribution of incident light in various regions of the grating, different diffraction efficiencies of regions are obtained, and the focusing field intensity is controlled (Fig. 5). According to the analysis of lens structural profile characteristics and diffraction mechanisms, when the proportion of incident light energy contributing to the first grating area of the lens is more than that of the second grating area, the grating diffraction efficiency is high and the electric field intensity increases with w0. When the contribution of incident light energy to the second grating area exceeds the first grating area, the grating diffraction efficiency decreases, and the electric field intensity becomes stable or even weakens with the rising w0 (Fig. 5). By utilizing the polarization independence of subwavelength grating lenses and adjusting the polarization composition of the incident field, solid single focus, "donut" shaped, "rocket" shaped, and "spindle" shaped focal fields can be obtained (Table 2).ObjectiveThe amplitude and polarization of cylindrical vector beams (CVBs) are distributed cylindrically and symmetrically, and the tight CVBs focusing plays an important role in optical micromanipulation, optical storage, laser micromachining, super-resolution imaging, particle acceleration, and other fields. At present, various focusing methods have been developed, such as traditional lenses, plasmonic lenses, negative refractive photonic crystal lenses, parabolic mirrors, and meta-lenses. However, there are limitations including diffraction limit, polarization dependence, and complex preparation. Subwavelength grating lens based on -1st order diffraction can achieve tight focusing of radial and azimuthal polarized lights spontaneously, breaking through the diffraction limit and realizing flexible focal field manipulation. Despite these advantages, the energy efficiency of its focal field still deserves further improvement. Therefore, we explore and propose a structural optimization scheme for a blazed subwavelength grating lens that can increase the energy ratio of -1st order diffracted light energy to enhance the focal field energy.MethodWe employ the full vector calculation of electromagnetic field (COMSOL Multiphysics software) based on the finite element method (FEM) to carry out specific research. The blazed structure is located on each grating step with a consistent height, and the overall lens structure is a uniform dielectric GaN. Firstly, an equivalent triangular prism model is built to verify the enhancement effect of the blazed structure on -1st order diffraction. Next, the energy and morphology changes of the focal field before and after modifying the blazed structure are compared, and the influence of the height, number, and location of blazed structures on the focal field is analyzed. Finally, the dynamic manipulation effect of the incident light amplitude distribution and polarization components on the focal field energy and morphology is studied.ConclusionWe propose a blazed subwavelength grating lens that can improve the diffraction efficiency of -1st order diffracted light and enhance the focal field energy of the negative refractive grating lens. As the preset focal length increases, the height of the blazed structure that satisfies the maximum diffraction efficiency of the lens also rises. The increasing number of blazed structures leads to more balanced energy of the outgoing beams in different regions and higher energy of the focal field. Meanwhile, the ability of the focal field to suppress the secondary focus is stronger, and the focal position is more accurate. By adjusting incident Gaussian radially polarized light, the dynamic control of the focal field energy is realized. Changing the polarization components of CVBs can also achieve lateral focusing modulation and obtain focal fields with diverse morphology. Finally, our study provides ideas for optimizing the focusing performance of subwavelength grating lenses and has potential applications in optical micromanipulation, super-resolution imaging, and other fields. Results and discussion In the equivalent prism model, adding the blazed gratings significantly increases the energy proportion of the -1st order diffracted light, which proves the feasibility of the optimization mechanism (Fig. 1). The hollow grating lens decorated with the blazed structure can significantly increase the focal field energy with the peak value increasing to 2.91 times, while the focusing position is slightly shifted and the focusing width is broadened (Fig. 2). Under different preset focal lengths, the deflection of the beam passing through the lens varies, and the relationship between the focal field energy and the height of the blazed structure also changes. At near and medium focal lengths, the focal field energy first increases and then decreases with the height, and at far focal lengths, the focal field energy increases with the height (Fig. 3). When the number of blazed structures changes, more of them cause the diffracted beams to interact with each other, offset part of the phase difference, and reduce focal shift, with improved focusing energy efficiency (Fig. 4). The incident light distribution can also manipulate the focal field. By controlling the beam parameters to adjust the energy distribution of incident light in various regions of the grating, different diffraction efficiencies of regions are obtained, and the focusing field intensity is controlled (Fig. 5). According to the analysis of lens structural profile characteristics and diffraction mechanisms, when the proportion of incident light energy contributing to the first grating area of the lens is more than that of the second grating area, the grating diffraction efficiency is high and the electric field intensity increases with w0. When the contribution of incident light energy to the second grating area exceeds the first grating area, the grating diffraction efficiency decreases, and the electric field intensity becomes stable or even weakens with the rising w0 (Fig. 5). By utilizing the polarization independence of subwavelength grating lenses and adjusting the polarization composition of the incident field, solid single focus, "donut" shaped, "rocket" shaped, and "spindle" shaped focal fields can be obtained (Table 2).ObjectiveThe amplitude and polarization of cylindrical vector beams (CVBs) are distributed cylindrically and symmetrically, and the tight CVBs focusing plays an important role in optical micromanipulation, optical storage, laser micromachining, super-resolution imaging, particle acceleration, and other fields. At present, various focusing methods have been developed, such as traditional lenses, plasmonic lenses, negative refractive photonic crystal lenses, parabolic mirrors, and meta-lenses. However, there are limitations including diffraction limit, polarization dependence, and complex preparation. Subwavelength grating lens based on -1st order diffraction can achieve tight focusing of radial and azimuthal polarized lights spontaneously, breaking through the diffraction limit and realizing flexible focal field manipulation. Despite these advantages, the energy efficiency of its focal field still deserves further improvement. Therefore, we explore and propose a structural optimization scheme for a blazed subwavelength grating lens that can increase the energy ratio of -1st order diffracted light energy to enhance the focal field energy.MethodWe employ the full vector calculation of electromagnetic field (COMSOL Multiphysics software) based on the finite element method (FEM) to carry out specific research. The blazed structure is located on each grating step with a consistent height, and the overall lens structure is a uniform dielectric GaN. Firstly, an equivalent triangular prism model is built to verify the enhancement effect of the blazed structure on -1st order diffraction. Next, the energy and morphology changes of the focal field before and after modifying the blazed structure are compared, and the influence of the height, number, and location of blazed structures on the focal field is analyzed. Finally, the dynamic manipulation effect of the incident light amplitude distribution and polarization components on the focal field energy and morphology is studied.ConclusionWe propose a blazed subwavelength grating lens that can improve the diffraction efficiency of -1st order diffracted light and enhance the focal field energy of the negative refractive grating lens. As the preset focal length increases, the height of the blazed structure that satisfies the maximum diffraction efficiency of the lens also rises. The increasing number of blazed structures leads to more balanced energy of the outgoing beams in different regions and higher energy of the focal field. Meanwhile, the ability of the focal field to suppress the secondary focus is stronger, and the focal position is more accurate. By adjusting incident Gaussian radially polarized light, the dynamic control of the focal field energy is realized. Changing the polarization components of CVBs can also achieve lateral focusing modulation and obtain focal fields with diverse morphology. Finally, our study provides ideas for optimizing the focusing performance of subwavelength grating lenses and has potential applications in optical micromanipulation, super-resolution imaging, and other fields.
Acta Optica Sinica
- Publication Date: Jan. 25, 2024
- Vol. 44, Issue 2, 0205001 (2024)
Design and Analysis of Multi-Wavelength Diffraction Lenses Based on Visible Light
Shupei Zheng, Bin Fan, Yiwei He, Hu Yang, Hao Zhang, Xijun Zhao, and Shuo Zhong
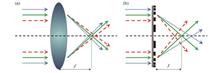
ObjectiveTraditional refractive lenses usually have a large thickness, thus limiting their application in some small optical systems. Diffraction lenses have a much smaller thickness than refractive lenses, so they are mostly employed in lightweight systems. Diffraction lenses, however, are usually designed to operate in a single band, which makes them more chromatic than refractive lenses. In fact, the chromatic difference of traditional refractive lenses is usually only determined by the material dispersion, while that of diffraction lenses is mainly caused by the change of diffraction angle on the microstructure of different positions. The angle is directly proportional to the wavelength of the incident light, and the dispersion caused by the change is much stronger than the material dispersion. At present, most achromatic diffraction lens technologies are characterized by complex structures and difficult processing. Therefore, designing an achromatic diffraction lens with simple structure and easy processing is the key to widely employing diffraction lenses.MethodsThis paper proposes a design method of multi-wavelength diffraction lens (MDL). The spectral point spread function (PSF) of a series of wavelengths is almost identical via adjusting and optimizing the distribution of diffraction microstructure on the plane substrate. This method can balance the PSF distribution of each wavelength, and reduce the color difference and complexity of the wideband imaging system. It provides a new idea for the application and development of diffraction imaging systems. The heights of diffraction lens microstructure are discretized and are assumed to be invariant over a width interval. An objective function is constructed to describe the sum of the deviations between the complex transmission function of MDL and the complex transmission function of DOE at each operating wavelength, and then the microstructure height that minimizes the objective function is found. The process is repeated on the whole surface of the lens, and the weight of each wavelength in the evaluation function is adjusted according to the simulation results. To verify the feasibility of the design method, this paper designs an MDL with three wavelengths and four steps combined with the existing processing conditions. The scalar diffraction theory is employed for simulation analysis and comparison with DOE. The design parameters are shown in Table 1.Results and DiscussionsThe simulation results show that MDL has the expected achromatic performance. DOE only has a sharp crest in its designed band, while in the other two bands, it almost does not respond or is diffused. A lot of noise is generated in the whole image plane, which leads to declined overall image quality. MDL has relatively sharp wave peaks in the three bands designed by MDL, and the response of the three bands in the image plane is relatively consistent, which will not produce a lot of noise in the image plane and can effectively reduce the color difference generated during the diffraction lens imaging, indicating that MDL has a certain achromatic ability. Half-peak full width (FWHM) is the peak width at half of the normalized light intensity. Compared with that of DOE, the minimum FWHM of MDL is slightly increased, but the overall performance is more balanced, and the mean square error of FWHM is only 0.0053 (Fig. 5). The spot size of MDL is also consistent at different wavelengths and has good imaging effects when the three wavelengths are incident together (Fig. 6). MDL sacrifices the diffraction efficiency of a certain band in exchange for improving the diffraction efficiency of the other bands. MTF of MDL in small field of view has little change, which reflects that MDL has certain anti-interference ability in small field of view (Fig. 8). When the three wavelengths are incident together, the diffraction efficiency of MDL is significantly higher than that of DOE (Fig. 9). The MDL is optimized for the bandwidth of the light source, and the achromatic performance of the optimized MDL is significantly improved under a certain bandwidth (Fig. 10). In terms of processing feasibility, the designed lens meets the processing conditions of multi-mask lithography.ConclusionsThis paper proposes a design method of diffraction lens that can work in multiple wavelengths simultaneously and designs a four-step MDL for simulation analysis. The results show that it can balance the imaging effect at multiple wavelengths. By comparison between PSF and MTF of DOE, the essence of MDL is found to sacrifice the imaging quality of one band to exchange the imaging quality of the other bands by regulating the surface microstructure distribution. The diffraction efficiency of MDL is also calculated, and the results show that the diffraction efficiency of MDL is higher than that of DOE when multiple wavelengths are incident together. Considering that there is no single wavelength of light in practical application, the MDL is optimized to have a good achromatic effect even under the light source with a certain bandwidth. Finally, the processing feasibility of MDL is analyzed, and the results show that it meets the existing processing conditions, thereby ensuring the feasibility of MDL in practical application. ObjectiveTraditional refractive lenses usually have a large thickness, thus limiting their application in some small optical systems. Diffraction lenses have a much smaller thickness than refractive lenses, so they are mostly employed in lightweight systems. Diffraction lenses, however, are usually designed to operate in a single band, which makes them more chromatic than refractive lenses. In fact, the chromatic difference of traditional refractive lenses is usually only determined by the material dispersion, while that of diffraction lenses is mainly caused by the change of diffraction angle on the microstructure of different positions. The angle is directly proportional to the wavelength of the incident light, and the dispersion caused by the change is much stronger than the material dispersion. At present, most achromatic diffraction lens technologies are characterized by complex structures and difficult processing. Therefore, designing an achromatic diffraction lens with simple structure and easy processing is the key to widely employing diffraction lenses.MethodsThis paper proposes a design method of multi-wavelength diffraction lens (MDL). The spectral point spread function (PSF) of a series of wavelengths is almost identical via adjusting and optimizing the distribution of diffraction microstructure on the plane substrate. This method can balance the PSF distribution of each wavelength, and reduce the color difference and complexity of the wideband imaging system. It provides a new idea for the application and development of diffraction imaging systems. The heights of diffraction lens microstructure are discretized and are assumed to be invariant over a width interval. An objective function is constructed to describe the sum of the deviations between the complex transmission function of MDL and the complex transmission function of DOE at each operating wavelength, and then the microstructure height that minimizes the objective function is found. The process is repeated on the whole surface of the lens, and the weight of each wavelength in the evaluation function is adjusted according to the simulation results. To verify the feasibility of the design method, this paper designs an MDL with three wavelengths and four steps combined with the existing processing conditions. The scalar diffraction theory is employed for simulation analysis and comparison with DOE. The design parameters are shown in Table 1.Results and DiscussionsThe simulation results show that MDL has the expected achromatic performance. DOE only has a sharp crest in its designed band, while in the other two bands, it almost does not respond or is diffused. A lot of noise is generated in the whole image plane, which leads to declined overall image quality. MDL has relatively sharp wave peaks in the three bands designed by MDL, and the response of the three bands in the image plane is relatively consistent, which will not produce a lot of noise in the image plane and can effectively reduce the color difference generated during the diffraction lens imaging, indicating that MDL has a certain achromatic ability. Half-peak full width (FWHM) is the peak width at half of the normalized light intensity. Compared with that of DOE, the minimum FWHM of MDL is slightly increased, but the overall performance is more balanced, and the mean square error of FWHM is only 0.0053 (Fig. 5). The spot size of MDL is also consistent at different wavelengths and has good imaging effects when the three wavelengths are incident together (Fig. 6). MDL sacrifices the diffraction efficiency of a certain band in exchange for improving the diffraction efficiency of the other bands. MTF of MDL in small field of view has little change, which reflects that MDL has certain anti-interference ability in small field of view (Fig. 8). When the three wavelengths are incident together, the diffraction efficiency of MDL is significantly higher than that of DOE (Fig. 9). The MDL is optimized for the bandwidth of the light source, and the achromatic performance of the optimized MDL is significantly improved under a certain bandwidth (Fig. 10). In terms of processing feasibility, the designed lens meets the processing conditions of multi-mask lithography.ConclusionsThis paper proposes a design method of diffraction lens that can work in multiple wavelengths simultaneously and designs a four-step MDL for simulation analysis. The results show that it can balance the imaging effect at multiple wavelengths. By comparison between PSF and MTF of DOE, the essence of MDL is found to sacrifice the imaging quality of one band to exchange the imaging quality of the other bands by regulating the surface microstructure distribution. The diffraction efficiency of MDL is also calculated, and the results show that the diffraction efficiency of MDL is higher than that of DOE when multiple wavelengths are incident together. Considering that there is no single wavelength of light in practical application, the MDL is optimized to have a good achromatic effect even under the light source with a certain bandwidth. Finally, the processing feasibility of MDL is analyzed, and the results show that it meets the existing processing conditions, thereby ensuring the feasibility of MDL in practical application.
Acta Optica Sinica
- Publication Date: May. 10, 2023
- Vol. 43, Issue 9, 0905001 (2023)
Analysis of Light Field Modulation by Large-Aperture Diffractive Element Based on Response Function
Dun Liu, Heng Shi, Lihua Wang, Guohan Gao, and Bin Fan
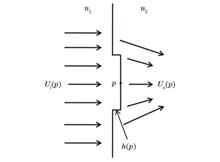
ObjectiveCompared with the traditional optical elements, diffractive optical elements (DOEs) have many advantages, such as light weight, flexible design, and unique dispersion. Greatly promoting the miniaturization and lightweight of optical systems, DOEs are widely used in laser communication, laser radar, space imaging, high-precision optical testing, and other fields. The high-precision analysis of light field modulation by DOEs is a key point in the application of DOEs. However, most optical design software calculates the deflection of light by DOEs with the grating equation model, ignoring the physical structure of DOEs. The quantitative analysis of the comprehensive performance of the system has defects, especially the analysis of energy utilization, stray light, and other performance. The thin element approximation (TEA) model based on the scalar diffraction theory is widely employed to quantitatively analyze the complex-amplitude transmittance, diffraction efficiency, and other properties of DOEs. When the microstructure size of a DOE is larger than 10 times the wavelength, the TEA model can obtain comparatively accurate results. However, the error increases rapidly as the microstructure size gradually approaches the order of magnitude of wavelength. The vector diffraction theory using mathematical tools to strictly solve Maxwell equations is a perfect solution for high-precision analysis of DOEs. Unfortunately, strict vector diffraction calculation involves a large amount of data and is thus generally applicable to small-size elements only. When the diffraction phenomenon of the microstructures is analyzed by the strict vector diffraction theory, violent oscillation of the light field is only observed at the positions with abrupt changes in height. Due to this phenomenon, the paper equates the effect of step microstructures on light wave modulation with step response functions and synthesizes the modulation effect of the DOE as the coherent superposition of multiple step response functions (STEP-RFs). When the incident light wave and the step microstructure have space-invariant characteristics, the modulation of the incident light wave by a large-size element can be quickly obtained by this method. The proposed method is expected to serve as a practical solution for high-precision and rapid analysis of large-aperture DOEs and promote the engineering application of such DOEs.MethodThe surface microstructures of most DOEs can be decomposed into multiple step structures. For example, the boss structure in Fig. 1 can be decomposed into a rising-edge step and a descending-edge step. Then, the modulation of the incident light field by the step structures is calculated by the vector diffraction theory and solidified into a step response function. Finally, the step response functions of all steps are synthesized into the response of the DOE according to the principle of coherent combination of the light fields. For large-aperture diffractive elements, this paper only needs to find out the characteristic step structures and conduct vector analysis of the characteristic steps by the strict vector theory to obtain the response functions before synthesizing the light field distribution after the incident light field is modulated by the DOE by the above method. Sub-window splicing is the most direct and effective strategy for light field synthesis for large-aperture DOEs. To ensure the influence of a step structure on the light field of adjacent sub-windows, the overlapping area of the sub-windows must be larger than half of the range of the response function.Results and DiscussionsSpecifically, the three main factors affecting calculation accuracy, i.e., the minimum linewidth of microstructures, the range of the response function, and the step positioning error, are studied. To quantitatively evaluate the calculation accuracy of the proposed response function method, this paper uses the results calculated by the finite-element method (FEM) as a reference to calculate the relative errors in amplitude and phase point by point and takes the root-mean-square (RMS) value of the relative errors as the quantitative evaluation index. When the range of the response function is larger than 7λ, the relative-error RMS of the light field tends to stabilize with small fluctuations (Table 1). Even when the minimum linewidth of the microstructure reaches one time the wavelength, the combined relative-error RMS of the amplitude and phase is kept below 6.1% (Fig. 3). The relative-error RMS increases linearly with the positioning error approximately (Fig. 5). When the positioning error is kept below 30 nm, the relative-error RMS increment of light field amplitude remains smaller than 5%, and the relative-error RMS of phase remains below 2%. For the further evaluation of the far-field characteristics of this method, the far-field distribution of the 2-level Fresnel lens is calculated by the Kirchhoff diffraction integral formula on the basis of the near-field obtained by the STEP-RFs. The diffraction efficiency and the characteristics of the point spread function are analyzed, as shown in Table 3. Compared with the results calculated by the FEM, the maximum relative light intensity error of the lens calculated by the proposed response function method is 1.8%, and the maximum relative error in diffraction efficiency is 1.64%. In addition, the calculation efficiency of the STEP-RFs is at least 1500 times higher than that of the COMSOL software (Table 5).ConclusionsThis paper proposes a fast and high-precision analysis method for large-aperture DOEs with variable periods. The minimum linewidth of the microstructure, the range of the response function, and the step positioning error are three main factors that affect calculation accuracy. The numerical calculation results show that a smaller minimum characteristic size of the microstructure corresponds to a larger calculation error. When the minimum linewidth of the microstructure is close to one time the wavelength, the relative-error RMS is smaller than 6.1%, and the accuracy is still high. When the range of the response function is larger than 7λ, the relative-error RMS of the light field tends to stabilize with small fluctuations. The relative-error RMS increases linearly with the positioning error approximately. When the positioning error is kept smaller than 30 nm, the relative-error RMS increment of the light field amplitude remains below 5%, and the relative-error RMS of phase remains smaller than 2%. The positioning error is inevitable in the calculation of large-aperture diffractive elements. Nevertheless, even if a positioning error smaller than 25 nm is present, the differences between the maximum light intensity and diffraction efficiency of the far field and the results of strict vector theory analysis are still smaller than 2%, and the accuracy is still high. At last, the computational efficiency of the proposed method is at least 1500 times higher than that of the COMSOL software, and the efficiency improvement effect is more salient for larger apertures. ObjectiveCompared with the traditional optical elements, diffractive optical elements (DOEs) have many advantages, such as light weight, flexible design, and unique dispersion. Greatly promoting the miniaturization and lightweight of optical systems, DOEs are widely used in laser communication, laser radar, space imaging, high-precision optical testing, and other fields. The high-precision analysis of light field modulation by DOEs is a key point in the application of DOEs. However, most optical design software calculates the deflection of light by DOEs with the grating equation model, ignoring the physical structure of DOEs. The quantitative analysis of the comprehensive performance of the system has defects, especially the analysis of energy utilization, stray light, and other performance. The thin element approximation (TEA) model based on the scalar diffraction theory is widely employed to quantitatively analyze the complex-amplitude transmittance, diffraction efficiency, and other properties of DOEs. When the microstructure size of a DOE is larger than 10 times the wavelength, the TEA model can obtain comparatively accurate results. However, the error increases rapidly as the microstructure size gradually approaches the order of magnitude of wavelength. The vector diffraction theory using mathematical tools to strictly solve Maxwell equations is a perfect solution for high-precision analysis of DOEs. Unfortunately, strict vector diffraction calculation involves a large amount of data and is thus generally applicable to small-size elements only. When the diffraction phenomenon of the microstructures is analyzed by the strict vector diffraction theory, violent oscillation of the light field is only observed at the positions with abrupt changes in height. Due to this phenomenon, the paper equates the effect of step microstructures on light wave modulation with step response functions and synthesizes the modulation effect of the DOE as the coherent superposition of multiple step response functions (STEP-RFs). When the incident light wave and the step microstructure have space-invariant characteristics, the modulation of the incident light wave by a large-size element can be quickly obtained by this method. The proposed method is expected to serve as a practical solution for high-precision and rapid analysis of large-aperture DOEs and promote the engineering application of such DOEs.MethodThe surface microstructures of most DOEs can be decomposed into multiple step structures. For example, the boss structure in Fig. 1 can be decomposed into a rising-edge step and a descending-edge step. Then, the modulation of the incident light field by the step structures is calculated by the vector diffraction theory and solidified into a step response function. Finally, the step response functions of all steps are synthesized into the response of the DOE according to the principle of coherent combination of the light fields. For large-aperture diffractive elements, this paper only needs to find out the characteristic step structures and conduct vector analysis of the characteristic steps by the strict vector theory to obtain the response functions before synthesizing the light field distribution after the incident light field is modulated by the DOE by the above method. Sub-window splicing is the most direct and effective strategy for light field synthesis for large-aperture DOEs. To ensure the influence of a step structure on the light field of adjacent sub-windows, the overlapping area of the sub-windows must be larger than half of the range of the response function.Results and DiscussionsSpecifically, the three main factors affecting calculation accuracy, i.e., the minimum linewidth of microstructures, the range of the response function, and the step positioning error, are studied. To quantitatively evaluate the calculation accuracy of the proposed response function method, this paper uses the results calculated by the finite-element method (FEM) as a reference to calculate the relative errors in amplitude and phase point by point and takes the root-mean-square (RMS) value of the relative errors as the quantitative evaluation index. When the range of the response function is larger than 7λ, the relative-error RMS of the light field tends to stabilize with small fluctuations (Table 1). Even when the minimum linewidth of the microstructure reaches one time the wavelength, the combined relative-error RMS of the amplitude and phase is kept below 6.1% (Fig. 3). The relative-error RMS increases linearly with the positioning error approximately (Fig. 5). When the positioning error is kept below 30 nm, the relative-error RMS increment of light field amplitude remains smaller than 5%, and the relative-error RMS of phase remains below 2%. For the further evaluation of the far-field characteristics of this method, the far-field distribution of the 2-level Fresnel lens is calculated by the Kirchhoff diffraction integral formula on the basis of the near-field obtained by the STEP-RFs. The diffraction efficiency and the characteristics of the point spread function are analyzed, as shown in Table 3. Compared with the results calculated by the FEM, the maximum relative light intensity error of the lens calculated by the proposed response function method is 1.8%, and the maximum relative error in diffraction efficiency is 1.64%. In addition, the calculation efficiency of the STEP-RFs is at least 1500 times higher than that of the COMSOL software (Table 5).ConclusionsThis paper proposes a fast and high-precision analysis method for large-aperture DOEs with variable periods. The minimum linewidth of the microstructure, the range of the response function, and the step positioning error are three main factors that affect calculation accuracy. The numerical calculation results show that a smaller minimum characteristic size of the microstructure corresponds to a larger calculation error. When the minimum linewidth of the microstructure is close to one time the wavelength, the relative-error RMS is smaller than 6.1%, and the accuracy is still high. When the range of the response function is larger than 7λ, the relative-error RMS of the light field tends to stabilize with small fluctuations. The relative-error RMS increases linearly with the positioning error approximately. When the positioning error is kept smaller than 30 nm, the relative-error RMS increment of the light field amplitude remains below 5%, and the relative-error RMS of phase remains smaller than 2%. The positioning error is inevitable in the calculation of large-aperture diffractive elements. Nevertheless, even if a positioning error smaller than 25 nm is present, the differences between the maximum light intensity and diffraction efficiency of the far field and the results of strict vector theory analysis are still smaller than 2%, and the accuracy is still high. At last, the computational efficiency of the proposed method is at least 1500 times higher than that of the COMSOL software, and the efficiency improvement effect is more salient for larger apertures.
Acta Optica Sinica
- Publication Date: Apr. 10, 2023
- Vol. 43, Issue 7, 0705001 (2023)
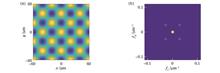
Two-Dimensional Talbot Effect in Uniaxial Crystals Orthogonal to Optical Axis
Yingyi Liu, and Jing Cheng
ObjectiveThe Talbot effect has been studied intensively in optics, acoustics, electron microscopy, X-ray, and Bose-Einstein condensates. There are numerous important applications of the Talbot self-imaging phenomenon in modern optics, such as in optical measurement, array illumination, lithography, color digital holography, and X-ray imaging technology. Uniaxial crystal is a typical kind of anisotropic media which has been widely used in different optical devices, so the propagation of light beams in uniaxial crystals is also an important topic in the field of optics and optoelectronics. However, no research has studied the behavior of periodic light fields in uniaxial crystals, especially the Talbot effect in uniaxial crystals. Therefore, in this work, we theoretically investigate the Talbot effect in uniaxial crystals orthogonal to the optical axis to prove that the Talbot self-imaging phenomenon can also be observed in anisotropic media. Our results can extend the studies of the Talbot effect to the field of anisotropic media and may improve our understanding of the transmission properties of periodic light fields.MethodsBased on the beam transmission theory in uniaxial crystals, we successfully derive theoretical formulas to investigate the Talbot effect due to the propagation of the two-dimensional (2D) orthogonal periodic light field along the direction perpendicular to the optical axis of the uniaxial crystal (z-axis) when the optical axis of the uniaxial crystal is along the x-axis. When a 2D periodic object is illuminated by an x-polarized coherent uniform beam, the propagation is described by anisotropic diffraction. With the help of the Fourier transform and angular spectrum representation, we can derive the self-imaging conditions of the Talbot effect and the expression of the conventional Talbot distances. We have also performed numerical simulations to observe the anisotropic propagation of two special 2D orthogonal periodic optical fields (2D sinusoidal grating and 2D checker grating) in the rutile crystal. In virtue of the structures of these periodic optical fields, the Talbot self-imaging phenomenon can be observed in shorter propagation distances. The Talbot images obtained by these two kinds of light fields in the rutile crystal are presented and analyzed.Results and DiscussionsWe find the self-imaging conditions of the Talbot effect. The expression of the conventional Talbot distances depends on the ratio of the ordinary refractive index to the extraordinary refractive index in the uniaxial crystal (no/ne) and the ratio of the period of the x direction to the period of the y direction in the 2D periodic object (px/py), as expressed by Eqs. (13) and (14). We have performed numerical simulations to observe the Talbot effect of the 2D sinusoidal grating and the 2D checker grating due to the anisotropic diffraction in the uniaxial crystal. In both cases, the Talbot images which are the same as their original gratings can be generated at reduced Talbot distances [Fig. 2 (a) and Fig. 5 (a)], and the complementary images of their original gratings can be generated at the reduced half-Talbot distance [Fig. 2(b) and Fig. 5(b)]. The Talbot sub-images with a half shift in space, whose intensity periods are halved from that of their original gratings and phase periods are the same as the period of the original gratings, are generated at the reduced quarter-Talbot distance and the reduced three-quarter-Talbot distance, as shown in Figs. 2(c)-(f) and Figs. 5(c)-(f). For the case of the 2D sinusoidal grating propagating along the z-axis (perpendicular to the optical axis of the uniaxial crystal), we have plotted the contrast variation of the intensity pattern and the phase contrast in a reduced Talbot distance (Fig. 3). The light intensity reaches its maximum value at the reduced Talbot distance and the reduced half-Talbot distance. At the reduced quarter-Talbot distance and the reduced three-quarter-Talbot distance, the light intensity reaches its minimum value. For the phase contrast, the maximum values are found at the reduced quarter-Talbot distance and the reduced three-quarter-Talbot distance.ConclusionsBased on the paraxial theory of light propagation in uniaxial crystals, we suppose that the optical axis is along the x-axis, and the propagation is along the z-axis. Furthermore, we have theoretically investigated the Talbot self-imaging phenomenon. When a 2D orthogonal periodic object is illuminated by the x-polarized coherent uniform beam, the anisotropic diffraction leads to the self-imaging conditions of the Talbot effect depending on no/ne and px/py. If the 2D orthogonal periodic optical object meets certain conditions, the Talbot images can be generated in shorter propagation distances, which means that the Talbot effect can be observed at reduced Talbot distances. Finally, for an incident light field linearly polarized at an arbitrary direction, the Talbot distance of the x-polarized component caused by the anisotropic diffraction does not equal that of the y-polarized component caused by the isotropic diffraction. Therefore, the repetition of the periodic light field can only occur at positions corresponding to the common multiples of these two distances. In other words, the Talbot distance corresponding to the arbitrarily linearly polarized case should be increased. ObjectiveThe Talbot effect has been studied intensively in optics, acoustics, electron microscopy, X-ray, and Bose-Einstein condensates. There are numerous important applications of the Talbot self-imaging phenomenon in modern optics, such as in optical measurement, array illumination, lithography, color digital holography, and X-ray imaging technology. Uniaxial crystal is a typical kind of anisotropic media which has been widely used in different optical devices, so the propagation of light beams in uniaxial crystals is also an important topic in the field of optics and optoelectronics. However, no research has studied the behavior of periodic light fields in uniaxial crystals, especially the Talbot effect in uniaxial crystals. Therefore, in this work, we theoretically investigate the Talbot effect in uniaxial crystals orthogonal to the optical axis to prove that the Talbot self-imaging phenomenon can also be observed in anisotropic media. Our results can extend the studies of the Talbot effect to the field of anisotropic media and may improve our understanding of the transmission properties of periodic light fields.MethodsBased on the beam transmission theory in uniaxial crystals, we successfully derive theoretical formulas to investigate the Talbot effect due to the propagation of the two-dimensional (2D) orthogonal periodic light field along the direction perpendicular to the optical axis of the uniaxial crystal (z-axis) when the optical axis of the uniaxial crystal is along the x-axis. When a 2D periodic object is illuminated by an x-polarized coherent uniform beam, the propagation is described by anisotropic diffraction. With the help of the Fourier transform and angular spectrum representation, we can derive the self-imaging conditions of the Talbot effect and the expression of the conventional Talbot distances. We have also performed numerical simulations to observe the anisotropic propagation of two special 2D orthogonal periodic optical fields (2D sinusoidal grating and 2D checker grating) in the rutile crystal. In virtue of the structures of these periodic optical fields, the Talbot self-imaging phenomenon can be observed in shorter propagation distances. The Talbot images obtained by these two kinds of light fields in the rutile crystal are presented and analyzed.Results and DiscussionsWe find the self-imaging conditions of the Talbot effect. The expression of the conventional Talbot distances depends on the ratio of the ordinary refractive index to the extraordinary refractive index in the uniaxial crystal (no/ne) and the ratio of the period of the x direction to the period of the y direction in the 2D periodic object (px/py), as expressed by Eqs. (13) and (14). We have performed numerical simulations to observe the Talbot effect of the 2D sinusoidal grating and the 2D checker grating due to the anisotropic diffraction in the uniaxial crystal. In both cases, the Talbot images which are the same as their original gratings can be generated at reduced Talbot distances [Fig. 2 (a) and Fig. 5 (a)], and the complementary images of their original gratings can be generated at the reduced half-Talbot distance [Fig. 2(b) and Fig. 5(b)]. The Talbot sub-images with a half shift in space, whose intensity periods are halved from that of their original gratings and phase periods are the same as the period of the original gratings, are generated at the reduced quarter-Talbot distance and the reduced three-quarter-Talbot distance, as shown in Figs. 2(c)-(f) and Figs. 5(c)-(f). For the case of the 2D sinusoidal grating propagating along the z-axis (perpendicular to the optical axis of the uniaxial crystal), we have plotted the contrast variation of the intensity pattern and the phase contrast in a reduced Talbot distance (Fig. 3). The light intensity reaches its maximum value at the reduced Talbot distance and the reduced half-Talbot distance. At the reduced quarter-Talbot distance and the reduced three-quarter-Talbot distance, the light intensity reaches its minimum value. For the phase contrast, the maximum values are found at the reduced quarter-Talbot distance and the reduced three-quarter-Talbot distance.ConclusionsBased on the paraxial theory of light propagation in uniaxial crystals, we suppose that the optical axis is along the x-axis, and the propagation is along the z-axis. Furthermore, we have theoretically investigated the Talbot self-imaging phenomenon. When a 2D orthogonal periodic object is illuminated by the x-polarized coherent uniform beam, the anisotropic diffraction leads to the self-imaging conditions of the Talbot effect depending on no/ne and px/py. If the 2D orthogonal periodic optical object meets certain conditions, the Talbot images can be generated in shorter propagation distances, which means that the Talbot effect can be observed at reduced Talbot distances. Finally, for an incident light field linearly polarized at an arbitrary direction, the Talbot distance of the x-polarized component caused by the anisotropic diffraction does not equal that of the y-polarized component caused by the isotropic diffraction. Therefore, the repetition of the periodic light field can only occur at positions corresponding to the common multiples of these two distances. In other words, the Talbot distance corresponding to the arbitrarily linearly polarized case should be increased.
Acta Optica Sinica
- Publication Date: Mar. 10, 2023
- Vol. 43, Issue 5, 0505001 (2023)

Calculation Method for Characteristic Parameters of Rectangular Gratings Under Batwing Effect
Xiaoxin Fan, Jiale Zhang, Zhishan Gao, Jianqiu Ma, Heran Li, Lu Chen, Lihua Lei, Yunxia Fu, Zhiyi Xu, Dan Zhu, Zhenyan Guo, and Qun Yuan
ObjectiveWhite light interferometry, as an effective non-destructive method, is widely employed for measuring characteristic parameters of microstructures. Among these microstructures, the rectangular grating is a typical periodic step structure and has extensive utilization in precision machining due to its diverse materialization properties based on surface morphology characteristic parameters. However, when the groove depth of the grating is smaller than the coherence length of the adopted light source, the batwing effect occurs near or at the edge of the step in the sample under measurement. ISO series 25178 provides a standard morphology for calculating the characteristic parameters of groove depth and linewidth through three-dimensional surface morphology analysis, which necessitates determining the position of the step edge. The batwing effect poses challenges to precisely locating the step edge position and may result in a false representation of information near the edge of the step discontinuity. We propose a new algorithm for determining the characteristic parameters of rectangular gratings by utilizing the distribution difference of the coherence signals between the upper and lower surfaces, thus avoiding the traditional method of extracting step edge position from three-dimensional surface morphology. The introduced algorithm demonstrates excellent measurement accuracy, high repeatability, and exceptional robustness in calculating the desired characteristic parameters of rectangular gratings.MethodsWe propose an algorithm for precise positioning of the step edge in rectangular gratings based on the distribution difference of the coherence peak among different sampling points. The algorithm is designed to improve the detection efficiency of characteristic parameters by incorporating parallel processing techniques. Firstly, during vertical scanning, the coherence signals undergo modulation. Simultaneously, the contrast information is obtained by the gravity method to extract the center of gravity position of the modulation envelope across all sampling points within the field of view. Then, the peak of the contrast envelope is calculated to further accentuate the discrepancy between the upper and lower surfaces of the rectangular grating. By identifying these surfaces, we acquire the step position information, which allows to generate the mask matrix and determine the linewidth values. To obtain the groove depth, we combine the mask matrix and three-dimensional surface morphology of the rectangular grating. Meanwhile, we extend the application of the "W/3" guideline specifically for the rectangular grating structure to mitigate the influence of the batwing effect on depth measurements. Additionally, we incorporate the Stoilov algorithm to calculate the contrast information during the vertical scanning, enabling simultaneous determination of the step edge position and three-dimensional surface morphology. This parallel processing approach enhances the efficiency and accuracy of the algorithm. Generally, our algorithm provides an effective means for precisely positioning the step edge in rectangular gratings, while considering the influence of the batwing effect on depth measurements.Results and DiscussionsExperiments are conducted via a self-developed white light interferometry system to evaluate the feasibility and accuracy of the proposed method. Two rectangular gratings with different characteristic parameters are selected as measurement samples. The first sample calibrated by Physikalisch-Technische Bundesanstalt (PTB) has a groove depth of 189.6 nm±1.0 nm and a linewidth of 6 μm. The second sample certified by VLSI standards traceable to the National Institute of Standards and Technology (NIST) has a groove depth of 90.5 nm±2.8 nm and a linewidth of 50 μm. Ten repeatability measurements are performed in the same area of each sample based on the proposed algorithm. For the first sample, the average depth value is determined to be 188.97 nm with a relative error of 0.33% [Fig. 8(a)]. The average linewidth value is measured to be 6.12 μm with a relative error of 2% [Fig. 8(b)]. Similarly, for the second sample, the average depth value is 90.10 nm with a relative error of 0.40% [Fig. 8(c)]. The average linewidth value is determined to be 99.04 μm with a relative error of 0.96% [Fig. 8(d)]. These measurement results demonstrate the accuracy and effectiveness of the algorithm. Furthermore, the standard deviation of the ten repeatability measurement results is analyzed to assess the algorithm stability. The small standard deviation confirms the consistent and reliable performance of the proposed method. Additionally, the influence of error terms during the experiment on the measurement results is investigated. Specifically, variations in sample placement tilt angle, interference fringe numbers, and interference fringe direction are examined. The results indicate that these error terms exert minimal effect on the measurements, highlighting the robustness of the proposed algorithm. In general, the experimental results validate the feasibility and accuracy of the algorithm in accurately determining the groove depth and linewidth of rectangular gratings. The algorithm exhibits stability and robustness and becomes a reliable tool for precise metrology in surface morphology measurements.ConclusionsWe present a new approach for accurately measuring the characteristic parameters of rectangular gratings under the batwing effect. Unlike conventional calibration methods, our method focuses on the distribution difference of coherence signals between the upper and lower surfaces of the grating. This approach addresses the limitations of ISO series 25178 in accurately measuring the characteristic parameters in the presence of the batwing effect. To validate this method, we conduct simulations of interferograms during the vertical scanning based on linear system theory. By analyzing the modulation envelope of these interferograms, we can precisely detect the step edge position and distinguish the upper and lower surfaces of the grating sample. Finally, by applying ISO standards, we accurately measure the characteristic parameters of the rectangular grating. Experimental results using two rectangular gratings with different groove depths and linewidths demonstrate the repeatability and robustness of our method. The implementation of the "W/3" guideline in measuring rectangular gratings is significantly improved to accurately measure the characteristic parameters. Importantly, our method features high efficiency, high precision, and fine repeatability without requiring any physical upgrades to the instrument. Considering the ongoing trend towards miniaturization of rectangular gratings, our method has broader applications. ObjectiveWhite light interferometry, as an effective non-destructive method, is widely employed for measuring characteristic parameters of microstructures. Among these microstructures, the rectangular grating is a typical periodic step structure and has extensive utilization in precision machining due to its diverse materialization properties based on surface morphology characteristic parameters. However, when the groove depth of the grating is smaller than the coherence length of the adopted light source, the batwing effect occurs near or at the edge of the step in the sample under measurement. ISO series 25178 provides a standard morphology for calculating the characteristic parameters of groove depth and linewidth through three-dimensional surface morphology analysis, which necessitates determining the position of the step edge. The batwing effect poses challenges to precisely locating the step edge position and may result in a false representation of information near the edge of the step discontinuity. We propose a new algorithm for determining the characteristic parameters of rectangular gratings by utilizing the distribution difference of the coherence signals between the upper and lower surfaces, thus avoiding the traditional method of extracting step edge position from three-dimensional surface morphology. The introduced algorithm demonstrates excellent measurement accuracy, high repeatability, and exceptional robustness in calculating the desired characteristic parameters of rectangular gratings.MethodsWe propose an algorithm for precise positioning of the step edge in rectangular gratings based on the distribution difference of the coherence peak among different sampling points. The algorithm is designed to improve the detection efficiency of characteristic parameters by incorporating parallel processing techniques. Firstly, during vertical scanning, the coherence signals undergo modulation. Simultaneously, the contrast information is obtained by the gravity method to extract the center of gravity position of the modulation envelope across all sampling points within the field of view. Then, the peak of the contrast envelope is calculated to further accentuate the discrepancy between the upper and lower surfaces of the rectangular grating. By identifying these surfaces, we acquire the step position information, which allows to generate the mask matrix and determine the linewidth values. To obtain the groove depth, we combine the mask matrix and three-dimensional surface morphology of the rectangular grating. Meanwhile, we extend the application of the "W/3" guideline specifically for the rectangular grating structure to mitigate the influence of the batwing effect on depth measurements. Additionally, we incorporate the Stoilov algorithm to calculate the contrast information during the vertical scanning, enabling simultaneous determination of the step edge position and three-dimensional surface morphology. This parallel processing approach enhances the efficiency and accuracy of the algorithm. Generally, our algorithm provides an effective means for precisely positioning the step edge in rectangular gratings, while considering the influence of the batwing effect on depth measurements.Results and DiscussionsExperiments are conducted via a self-developed white light interferometry system to evaluate the feasibility and accuracy of the proposed method. Two rectangular gratings with different characteristic parameters are selected as measurement samples. The first sample calibrated by Physikalisch-Technische Bundesanstalt (PTB) has a groove depth of 189.6 nm±1.0 nm and a linewidth of 6 μm. The second sample certified by VLSI standards traceable to the National Institute of Standards and Technology (NIST) has a groove depth of 90.5 nm±2.8 nm and a linewidth of 50 μm. Ten repeatability measurements are performed in the same area of each sample based on the proposed algorithm. For the first sample, the average depth value is determined to be 188.97 nm with a relative error of 0.33% [Fig. 8(a)]. The average linewidth value is measured to be 6.12 μm with a relative error of 2% [Fig. 8(b)]. Similarly, for the second sample, the average depth value is 90.10 nm with a relative error of 0.40% [Fig. 8(c)]. The average linewidth value is determined to be 99.04 μm with a relative error of 0.96% [Fig. 8(d)]. These measurement results demonstrate the accuracy and effectiveness of the algorithm. Furthermore, the standard deviation of the ten repeatability measurement results is analyzed to assess the algorithm stability. The small standard deviation confirms the consistent and reliable performance of the proposed method. Additionally, the influence of error terms during the experiment on the measurement results is investigated. Specifically, variations in sample placement tilt angle, interference fringe numbers, and interference fringe direction are examined. The results indicate that these error terms exert minimal effect on the measurements, highlighting the robustness of the proposed algorithm. In general, the experimental results validate the feasibility and accuracy of the algorithm in accurately determining the groove depth and linewidth of rectangular gratings. The algorithm exhibits stability and robustness and becomes a reliable tool for precise metrology in surface morphology measurements.ConclusionsWe present a new approach for accurately measuring the characteristic parameters of rectangular gratings under the batwing effect. Unlike conventional calibration methods, our method focuses on the distribution difference of coherence signals between the upper and lower surfaces of the grating. This approach addresses the limitations of ISO series 25178 in accurately measuring the characteristic parameters in the presence of the batwing effect. To validate this method, we conduct simulations of interferograms during the vertical scanning based on linear system theory. By analyzing the modulation envelope of these interferograms, we can precisely detect the step edge position and distinguish the upper and lower surfaces of the grating sample. Finally, by applying ISO standards, we accurately measure the characteristic parameters of the rectangular grating. Experimental results using two rectangular gratings with different groove depths and linewidths demonstrate the repeatability and robustness of our method. The implementation of the "W/3" guideline in measuring rectangular gratings is significantly improved to accurately measure the characteristic parameters. Importantly, our method features high efficiency, high precision, and fine repeatability without requiring any physical upgrades to the instrument. Considering the ongoing trend towards miniaturization of rectangular gratings, our method has broader applications.
Acta Optica Sinica
- Publication Date: Nov. 25, 2023
- Vol. 43, Issue 22, 2205004 (2023)
Design of Total Internal Reflection Immersed Gratings with High Diffraction Efficiency and Low Polarization Sensitivity
Huiying Chen, Xinhua Chen, Qiao Pan, Jiacheng Zhu, and Weimin Shen
ObjectiveThe concentration of greenhouse gases in the earth's atmosphere is increasing year by year under the influence of fuel burning, deforestation, and industrial development. The continuous emission of greenhouse gases will result in increased global temperature and extreme weather such as heavy rainfall and sea level rise. Remote sensing of greenhouse gases is an important method for tracking greenhouse gas emissions and understanding the earth's climate evolution. As one of the most important optical payloads for spaceborne greenhouse gas monitoring, the grating imaging spectrometer features high resolution, high signal-to-noise ratio, and nearly linear dispersion. The immersed grating can achieve higher spectral resolution and more compact structural size and has been employed as the dispersion elements in imaging spectrometer for remote sensing of greenhouse gases. Currently, immersed gratings with higher performance are required to fulfill the requirements for more accurate greenhouse gas monitoring. For conventional reflective immersed gratings, metallic coatings are adopted to reflect the incident light. However, there are many disadvantages for the metallic coating. Firstly, this coating may cause resonance absorption due to the plasmon effect. The resonance absorption will decrease the diffraction efficiency and increase the polarization sensitivity of the grating. Secondly, it is difficult to deposit metal materials on the grating groove, which will also cause decreased diffraction efficiency. To this end, we propose and design a total internal reflection immersed grating whose grating groove is coated with nano laminate. It has high diffraction efficiency and low polarization sensitivity and can be utilized in the O2-A channel for the imaging spectrometer of greenhouse gas monitoring.MethodsAccording to the monitoring requirements of greenhouse gases, the design of the immersed grating is as follows. Firstly, the grating structure is modeled by the finite element software, and the diffraction efficiency and polarization sensitivity of the initial structure are calculated. Then, the parameters such as the duty cycle of the grating, the thickness of the nano laminate, the groove depth, and the refractive index of the nano laminate are optimized in turn with the controlled variable method. According to the optical film theory and the actual coating method, the thickness and stacking sequence of the nano laminate are optimized, and the multi-layer film structure is obtained. Finally, the manufacturing tolerance of the designed immersed grating is analyzed, and the tolerance of the grating with diffraction efficiency greater than 90% and polarization sensitivity less than 1% is presented.Results and DiscussionsBased on the introduced design method, an immersed grating working under the total internal reflection and coated with the nano laminate is designed, and it has high diffraction efficiency and low polarization sensitivity. Benefiting from the advantages of total internal reflection, the designed immersed grating has no transmission order, and the diffraction light energy is concentrated on the reflection diffraction order, which is helpful to improve the diffraction efficiency. Additionally, the coating on the grating groove is the nano laminate structure, which is alternately stacked with Al2O3 and TiO2 materials (Fig. 7). The nano laminate can improve the diffraction efficiency of the grating in the transverse electricity (TE) and transverse magnetism (TM) directions, and reduce the polarization sensitivity. The results show that the average diffraction efficiency of the design immersed grating at the -1 order is higher than 92%, and the polarization sensitivity is lower than 1% in the working band of 750–770 nm (Fig. 8).ConclusionsOur paper provides the spectral resolution formula of immersed gratings based on the principle of immersed gratings and shows that the immersed grating can reduce the size of the optical system and achieve high spectral resolution. According to the working conditions and grating parameters given by the optical design, fused silica is selected as the grating substrate, and a total internal reflection immersed diffraction grating with high diffraction efficiency and low polarization sensitivity is designed. The corresponding manufacturing tolerances are analyzed by considering the diffraction efficiency and polarization sensitivity requirements and the manufacturing method. The presented reflective immersed grating in our paper has the advantages of high diffraction efficiency and low polarization, and the grating groove tolerance is feasible for manufacturing. Therefore, our study lays a basis for the design of high-performance reflective immersed gratings. ObjectiveThe concentration of greenhouse gases in the earth's atmosphere is increasing year by year under the influence of fuel burning, deforestation, and industrial development. The continuous emission of greenhouse gases will result in increased global temperature and extreme weather such as heavy rainfall and sea level rise. Remote sensing of greenhouse gases is an important method for tracking greenhouse gas emissions and understanding the earth's climate evolution. As one of the most important optical payloads for spaceborne greenhouse gas monitoring, the grating imaging spectrometer features high resolution, high signal-to-noise ratio, and nearly linear dispersion. The immersed grating can achieve higher spectral resolution and more compact structural size and has been employed as the dispersion elements in imaging spectrometer for remote sensing of greenhouse gases. Currently, immersed gratings with higher performance are required to fulfill the requirements for more accurate greenhouse gas monitoring. For conventional reflective immersed gratings, metallic coatings are adopted to reflect the incident light. However, there are many disadvantages for the metallic coating. Firstly, this coating may cause resonance absorption due to the plasmon effect. The resonance absorption will decrease the diffraction efficiency and increase the polarization sensitivity of the grating. Secondly, it is difficult to deposit metal materials on the grating groove, which will also cause decreased diffraction efficiency. To this end, we propose and design a total internal reflection immersed grating whose grating groove is coated with nano laminate. It has high diffraction efficiency and low polarization sensitivity and can be utilized in the O2-A channel for the imaging spectrometer of greenhouse gas monitoring.MethodsAccording to the monitoring requirements of greenhouse gases, the design of the immersed grating is as follows. Firstly, the grating structure is modeled by the finite element software, and the diffraction efficiency and polarization sensitivity of the initial structure are calculated. Then, the parameters such as the duty cycle of the grating, the thickness of the nano laminate, the groove depth, and the refractive index of the nano laminate are optimized in turn with the controlled variable method. According to the optical film theory and the actual coating method, the thickness and stacking sequence of the nano laminate are optimized, and the multi-layer film structure is obtained. Finally, the manufacturing tolerance of the designed immersed grating is analyzed, and the tolerance of the grating with diffraction efficiency greater than 90% and polarization sensitivity less than 1% is presented.Results and DiscussionsBased on the introduced design method, an immersed grating working under the total internal reflection and coated with the nano laminate is designed, and it has high diffraction efficiency and low polarization sensitivity. Benefiting from the advantages of total internal reflection, the designed immersed grating has no transmission order, and the diffraction light energy is concentrated on the reflection diffraction order, which is helpful to improve the diffraction efficiency. Additionally, the coating on the grating groove is the nano laminate structure, which is alternately stacked with Al2O3 and TiO2 materials (Fig. 7). The nano laminate can improve the diffraction efficiency of the grating in the transverse electricity (TE) and transverse magnetism (TM) directions, and reduce the polarization sensitivity. The results show that the average diffraction efficiency of the design immersed grating at the -1 order is higher than 92%, and the polarization sensitivity is lower than 1% in the working band of 750–770 nm (Fig. 8).ConclusionsOur paper provides the spectral resolution formula of immersed gratings based on the principle of immersed gratings and shows that the immersed grating can reduce the size of the optical system and achieve high spectral resolution. According to the working conditions and grating parameters given by the optical design, fused silica is selected as the grating substrate, and a total internal reflection immersed diffraction grating with high diffraction efficiency and low polarization sensitivity is designed. The corresponding manufacturing tolerances are analyzed by considering the diffraction efficiency and polarization sensitivity requirements and the manufacturing method. The presented reflective immersed grating in our paper has the advantages of high diffraction efficiency and low polarization, and the grating groove tolerance is feasible for manufacturing. Therefore, our study lays a basis for the design of high-performance reflective immersed gratings.
Acta Optica Sinica
- Publication Date: Nov. 25, 2023
- Vol. 43, Issue 22, 2205003 (2023)
Bandwidth Matching-Based Multiplexed Volume Holographic Grating
Qibin Feng, Jiahao Cai, Yusong Guo, Min Guo, Zi Wang, and Lü Guoqiang
ObjectiveThe performance of a volume holographic grating as an incoupling/outcoupling element seriously affects the field of view (FOV) of a waveguide system. Many studies try to extend the incident angle response bandwidth of the volume holographic gratings to increase FOV. Most volume holographic gratings are designed based on the center ray. However, in a waveguide system, the collimation system converts the position information on the image source into angular information, which makes the beam incident to the volume holographic grating within a certain angle range (Δθ). Based on the Kogelnik theory, the angular range of the diffracted beam Δθ' is much larger than Δθ. Since the diffracted beam of the incoupling grating is the incident beam of the outcoupling grating, the mismatch between Δθ and Δθ' will make the outcoupling grating cannot fully receive all the angular information in the diffracted beam, causing insufficient transmitted image information. We propose a design method of multiplexed volume holographic gratings. The response bandwidth of the outcoupling grating is increased through multi-time multiplexing, while the diffraction angle offset range of the incoupling grating is reduced to match its bandwidth as much as possible, which can guarantee that enough image information can be received to increase the FOV of a waveguide system.MethodsThe analysis reveals that the factors limiting the FOV of the waveguide system include not only the response bandwidth of the volume holographic grating itself but also the bandwidth mismatch between incoupling grating and outcoupling grating. Therefore, a design method of multiplexed volume holographic gratings is proposed. The object and reference light preparation angles of a single grating are determined according to the total reflection condition of the waveguide. The diffraction efficiency corresponding to each of its angles is calculated, as well as the response bandwidth of the incoupling grating, the diffracted light angle of the incoupling grating, and the response bandwidth of the outcoupling grating. The diffracted light angle range of the incoupling grating is revealed to be much larger than the response bandwidth of the outcoupling grating, with a bandwidth mismatch. According to the multiplexed coupled wave theory, the bandwidth extension of the multiplexed gratings can be compounded together in a similar way as superposition. Based on the angular range of the bandwidth mismatch occurrence, the response bandwidth of the outcoupling grating is expanded by the multiplexed method, and the diffracted light angle of the incoupling grating is contracted at the same time. This makes the incoupling/outcoupling grating bandwidths match as much as possible, compensating for the lack of some image information when the waveguide system is imaged.Results and DiscussionsFirstly, the diffraction efficiency corresponding to each of its angles is calculated based on the parameters of the designed single grating (Fig. 3). Meanwhile, image simulation is performed by simulation software (Fig. 6) and the diagonal FOV of the waveguide system is 16.1°. The horizontal FOV is too small, resulting in the inability to fully couple out the image coupled into the waveguide. Therefore, the multiplexed grating angle is designed (Fig. 4) to match the incoupling/outcoupling grating response bandwidths. The FOV is further extended to 18.7° (Fig. 7). The angular information of the coupled-in waveguide should be increased to further increase the FOV. Triple multiplexing is performed based on the secondary multiplexing, and the response bandwidth of the incoupling grating is extended simultaneously (Fig. 8). The simulation results show that the diagonal FOV can reach 22.9° (Fig. 9). The multiplexed volume holographic grating designed by this method is simple to prepare and can expand the FOV of the waveguide system.ConclusionsWe first analyze the bandwidth mismatch in the incoupling/outcoupling gratings of the waveguide system. The factors limiting the FOV of the holographic waveguide system are not only the response bandwidth of the volume holographic grating itself but also the bandwidth mismatch between the incoupling grating and outcoupling grating. Therefore, a design method of multiplexed volume holographic grating is proposed to control its diffraction angle and the response bandwidth of the outcoupling grating. Based on the multiplexed coupled wave theory, the secondary multiplexed grating is first designed. Additionally, the response bandwidth of the outcoupling grating is expanded and the contraction of its diffraction angle is realized at the same time. The image simulation and the optimized design of triple multiplexing are further carried out, whose diagonal FOV of the holographic waveguide system is improved to 22.9°. The FOV of the waveguide system can be further enlarged by more times of multiplexed design. The designed multiplexed holographic grating is simple to prepare and can extend the FOV of the waveguide system with limited refractive index modulation. ObjectiveThe performance of a volume holographic grating as an incoupling/outcoupling element seriously affects the field of view (FOV) of a waveguide system. Many studies try to extend the incident angle response bandwidth of the volume holographic gratings to increase FOV. Most volume holographic gratings are designed based on the center ray. However, in a waveguide system, the collimation system converts the position information on the image source into angular information, which makes the beam incident to the volume holographic grating within a certain angle range (Δθ). Based on the Kogelnik theory, the angular range of the diffracted beam Δθ' is much larger than Δθ. Since the diffracted beam of the incoupling grating is the incident beam of the outcoupling grating, the mismatch between Δθ and Δθ' will make the outcoupling grating cannot fully receive all the angular information in the diffracted beam, causing insufficient transmitted image information. We propose a design method of multiplexed volume holographic gratings. The response bandwidth of the outcoupling grating is increased through multi-time multiplexing, while the diffraction angle offset range of the incoupling grating is reduced to match its bandwidth as much as possible, which can guarantee that enough image information can be received to increase the FOV of a waveguide system.MethodsThe analysis reveals that the factors limiting the FOV of the waveguide system include not only the response bandwidth of the volume holographic grating itself but also the bandwidth mismatch between incoupling grating and outcoupling grating. Therefore, a design method of multiplexed volume holographic gratings is proposed. The object and reference light preparation angles of a single grating are determined according to the total reflection condition of the waveguide. The diffraction efficiency corresponding to each of its angles is calculated, as well as the response bandwidth of the incoupling grating, the diffracted light angle of the incoupling grating, and the response bandwidth of the outcoupling grating. The diffracted light angle range of the incoupling grating is revealed to be much larger than the response bandwidth of the outcoupling grating, with a bandwidth mismatch. According to the multiplexed coupled wave theory, the bandwidth extension of the multiplexed gratings can be compounded together in a similar way as superposition. Based on the angular range of the bandwidth mismatch occurrence, the response bandwidth of the outcoupling grating is expanded by the multiplexed method, and the diffracted light angle of the incoupling grating is contracted at the same time. This makes the incoupling/outcoupling grating bandwidths match as much as possible, compensating for the lack of some image information when the waveguide system is imaged.Results and DiscussionsFirstly, the diffraction efficiency corresponding to each of its angles is calculated based on the parameters of the designed single grating (Fig. 3). Meanwhile, image simulation is performed by simulation software (Fig. 6) and the diagonal FOV of the waveguide system is 16.1°. The horizontal FOV is too small, resulting in the inability to fully couple out the image coupled into the waveguide. Therefore, the multiplexed grating angle is designed (Fig. 4) to match the incoupling/outcoupling grating response bandwidths. The FOV is further extended to 18.7° (Fig. 7). The angular information of the coupled-in waveguide should be increased to further increase the FOV. Triple multiplexing is performed based on the secondary multiplexing, and the response bandwidth of the incoupling grating is extended simultaneously (Fig. 8). The simulation results show that the diagonal FOV can reach 22.9° (Fig. 9). The multiplexed volume holographic grating designed by this method is simple to prepare and can expand the FOV of the waveguide system.ConclusionsWe first analyze the bandwidth mismatch in the incoupling/outcoupling gratings of the waveguide system. The factors limiting the FOV of the holographic waveguide system are not only the response bandwidth of the volume holographic grating itself but also the bandwidth mismatch between the incoupling grating and outcoupling grating. Therefore, a design method of multiplexed volume holographic grating is proposed to control its diffraction angle and the response bandwidth of the outcoupling grating. Based on the multiplexed coupled wave theory, the secondary multiplexed grating is first designed. Additionally, the response bandwidth of the outcoupling grating is expanded and the contraction of its diffraction angle is realized at the same time. The image simulation and the optimized design of triple multiplexing are further carried out, whose diagonal FOV of the holographic waveguide system is improved to 22.9°. The FOV of the waveguide system can be further enlarged by more times of multiplexed design. The designed multiplexed holographic grating is simple to prepare and can extend the FOV of the waveguide system with limited refractive index modulation.
Acta Optica Sinica
- Publication Date: Nov. 25, 2023
- Vol. 43, Issue 22, 2205002 (2023)
Temperature Drift Error Correction of F-P Filter Based on Attention Mechanism and LSTM Network
Wenjuan Sheng, Jun Hu, and Gangding Peng
ObjectiveThe fiber Fabry-Perot (F-P) filter plays a critical role in fiber Bragg grating (FBG) wavelength demodulation systems. However, the continuous drift in the transmission wavelength and driving voltage curve of the F-P filter due to changes in the ambient temperature can significantly decrease the wavelength demodulation accuracy. To correct the drift error, researchers have proposed several wavelength correction methods, such as the F-P etalon, FBG reference grating, and gas absorption line reference methods. Despite high accuracy, these methods can increase the system's cost and complexity. Recently, with the increased applications of artificial intelligence, machine learning methods have emerged as a novel and highly portable option for correcting temperature drift errors in F-P filter at a relatively low cost. Currently, the most commonly employed technique for temperature drift correction is support vector machine (SVM), which does not take into account the high temporal correlation among samples before and after temperature drift data. To this end, we propose an Attention-LSTM network-based temperature drift correction method for F-P filters. The temperature drift data for the F-P filter is a typical time series with dynamic characteristics, indicating that the current drift depends both on the present input and the past input. We adopt the LSTM model for feature extraction and apply the attention mechanism to assign different weights to various input features. The combination of short-term and long-term memory, along with the attention mechanism, enhances the demodulation accuracy of the F-P filter.MethodsWe select FBG0 as the reference grating and the other three FBGs as sensing gratings. The input features employed in the model include temperature, temperature change rate, and the spectral position of FBG0. The output of the model is the absolute wavelength drift of sensing FBG3. Due to the strong temporal correlation in the temperature drift data of the F-P filter, a fixed length of time series samples is first selected, and then a multi-temporal training dataset is obtained by sliding it successively in a backward direction. By adopting the LSTM algorithm, the hidden states are generated for each time step by learning the input information of the current and past times and are then integrated into a context vector that serves as the input for the attention layer. The attention layer processes the data further by assigning weights to give significant information larger values, highlights important information, and filters out useless information, thus improving the model's prediction accuracy. The ReLU layer is employed after the attention layer to enhance the model's non-linear fitting abilities. Finally, a linear layer is adopted for dimensionality reduction to obtain the temperature drift prediction results of the F-P filter. The proposed model's effectiveness is validated by comparing it to the traditional LSTM model in the same temperature environment.Results and DiscussionsIn a heating-cooling-heating temperature variation environment, the proposed model is compared to a traditional LSTM model in error correction results of temperature drift for the three sensing gratings (Table 2). Experimental results show that the maximum temperature drift correction error of the traditional LSTM model is 16.64 pm, while the Attention-LSTM model reduces the maximum temperature drift correction error to 6.75 pm. Additionally, the proposed model is compared to common temperature drift models such as LSSVM, RNN, and LSTM in a slowly changing monotonous cooling environment (Table 3). Experimental results indicate that the performance of the Attention-LSTM model is superior to other temperature drift models. The above experimental results demonstrate that the proposed model integrates the attention mechanism with traditional LSTM models for time series modeling. This model adopts LSTM to extract long-term and short-term data sample information over time and the attention mechanism to assign different weights to the sample features. As a result, important feature information is highlighted, and the demodulation accuracy and stability are improved.ConclusionsWe thoroughly consider the time correlation between temperature drift data samples and the dynamic drift law. We not only take into account the influence of current inputs on the drift amount but also capture the effect of past inputs on the demodulation results. The LSTM model is employed for feature extraction and an attention mechanism is introduced to propose an F-P filter temperature drift error correction method based on the Attention-LSTM network. The attention mechanism assigns different weights to different features in the model to improve the modeling accuracy of the LSTM model. We conduct temperature drift error correction experiments in two temperature variation environments and compare the Attention-LSTM model with traditional LSTM model, RNN model, and LSSVM model. Experimental results demonstrate that the performance of the Attention-LSTM model in temperature drift error correction is significantly better than that of other models, with a MAXE of only 5.39 pm and MAE and RMSE of just 2.07 pm and 2.62 pm respectively. Meanwhile, compared to traditional hardware methods, the proposed error correction method based on the attention mechanism and LSTM network is low-cost with high portability, as it does not require any hardware equipment. This approach provides a new perspective for temperature drift error correction of tunable F-P filters. ObjectiveThe fiber Fabry-Perot (F-P) filter plays a critical role in fiber Bragg grating (FBG) wavelength demodulation systems. However, the continuous drift in the transmission wavelength and driving voltage curve of the F-P filter due to changes in the ambient temperature can significantly decrease the wavelength demodulation accuracy. To correct the drift error, researchers have proposed several wavelength correction methods, such as the F-P etalon, FBG reference grating, and gas absorption line reference methods. Despite high accuracy, these methods can increase the system's cost and complexity. Recently, with the increased applications of artificial intelligence, machine learning methods have emerged as a novel and highly portable option for correcting temperature drift errors in F-P filter at a relatively low cost. Currently, the most commonly employed technique for temperature drift correction is support vector machine (SVM), which does not take into account the high temporal correlation among samples before and after temperature drift data. To this end, we propose an Attention-LSTM network-based temperature drift correction method for F-P filters. The temperature drift data for the F-P filter is a typical time series with dynamic characteristics, indicating that the current drift depends both on the present input and the past input. We adopt the LSTM model for feature extraction and apply the attention mechanism to assign different weights to various input features. The combination of short-term and long-term memory, along with the attention mechanism, enhances the demodulation accuracy of the F-P filter.MethodsWe select FBG0 as the reference grating and the other three FBGs as sensing gratings. The input features employed in the model include temperature, temperature change rate, and the spectral position of FBG0. The output of the model is the absolute wavelength drift of sensing FBG3. Due to the strong temporal correlation in the temperature drift data of the F-P filter, a fixed length of time series samples is first selected, and then a multi-temporal training dataset is obtained by sliding it successively in a backward direction. By adopting the LSTM algorithm, the hidden states are generated for each time step by learning the input information of the current and past times and are then integrated into a context vector that serves as the input for the attention layer. The attention layer processes the data further by assigning weights to give significant information larger values, highlights important information, and filters out useless information, thus improving the model's prediction accuracy. The ReLU layer is employed after the attention layer to enhance the model's non-linear fitting abilities. Finally, a linear layer is adopted for dimensionality reduction to obtain the temperature drift prediction results of the F-P filter. The proposed model's effectiveness is validated by comparing it to the traditional LSTM model in the same temperature environment.Results and DiscussionsIn a heating-cooling-heating temperature variation environment, the proposed model is compared to a traditional LSTM model in error correction results of temperature drift for the three sensing gratings (Table 2). Experimental results show that the maximum temperature drift correction error of the traditional LSTM model is 16.64 pm, while the Attention-LSTM model reduces the maximum temperature drift correction error to 6.75 pm. Additionally, the proposed model is compared to common temperature drift models such as LSSVM, RNN, and LSTM in a slowly changing monotonous cooling environment (Table 3). Experimental results indicate that the performance of the Attention-LSTM model is superior to other temperature drift models. The above experimental results demonstrate that the proposed model integrates the attention mechanism with traditional LSTM models for time series modeling. This model adopts LSTM to extract long-term and short-term data sample information over time and the attention mechanism to assign different weights to the sample features. As a result, important feature information is highlighted, and the demodulation accuracy and stability are improved.ConclusionsWe thoroughly consider the time correlation between temperature drift data samples and the dynamic drift law. We not only take into account the influence of current inputs on the drift amount but also capture the effect of past inputs on the demodulation results. The LSTM model is employed for feature extraction and an attention mechanism is introduced to propose an F-P filter temperature drift error correction method based on the Attention-LSTM network. The attention mechanism assigns different weights to different features in the model to improve the modeling accuracy of the LSTM model. We conduct temperature drift error correction experiments in two temperature variation environments and compare the Attention-LSTM model with traditional LSTM model, RNN model, and LSSVM model. Experimental results demonstrate that the performance of the Attention-LSTM model in temperature drift error correction is significantly better than that of other models, with a MAXE of only 5.39 pm and MAE and RMSE of just 2.07 pm and 2.62 pm respectively. Meanwhile, compared to traditional hardware methods, the proposed error correction method based on the attention mechanism and LSTM network is low-cost with high portability, as it does not require any hardware equipment. This approach provides a new perspective for temperature drift error correction of tunable F-P filters.
Acta Optica Sinica
- Publication Date: Nov. 25, 2023
- Vol. 43, Issue 22, 2205001 (2023)
Temperature Shift Compensation of Fiber Fabry-Perot Tunable Filter Based on Time Weight
Wenjuan Sheng, Chuning Zhong, and Gangding Peng
ObjectiveFiber Fabry-Perot tunable filters (FFP-TF) controlled by piezoelectric ceramics are prone to temperature drift in fiber Bragg grating (FBG) sensing systems. During the long-term measurement process, FFP-TF will cause continuous drift of the output wavelength, which will adversely damage the FBG sensing system's measurement accuracy. At the moment, FFP-TF temperature drift compensation primarily entails adding hardware calibration modules to the FBG sensing system, such as the reference grating method, F-P etalon method, gas absorption method, and composite wavelength reference method. Although these technologies can efficiently adjust for temperature drift, they greatly increase the system's cost and complexity. As a result, utilizing software approaches to compensate for temperature drift in FFP-TF is a practical and low-cost method. However, most contemporary temperature drift compensation approaches based on artificial intelligence technologies neglect temperature drift data's temporal features. In fact, the fresh sample has a higher impact on the prediction outcomes of the following data than the old sample. As a result, this work extensively addresses the impact of temporal features on temperature drift compensation when processing temperature drift and other highly time-dependent data. A tunable filter temperature drift compensation approach with time weight is suggested based on the AdaBoost-SVM algorithm and time weight.MethodsWe use FBG0 as the reference grating and the other three FBGs as sensing gratings, and each sensing grating is modeled individually. The temperature-related values of the experimental environment are chosen as the model's input features in this investigation. Furthermore, because the wavelength drift errors of each FBG in the FFP-TF output spectrum have a high correlation, we use the drift of the reference grating as an input feature of the dynamic compensation model to compensate for the lack of accurate temperature information in the F-P cavity. The significant link between the temperature drift sequence data before and after is taken into account in full by this investigation. The idea of time weight is introduced in the process of modeling the temperature drift of FFP-TF to assign various temporal attributes to each sample. After that, temperature drift samples are modeled using support vector machines (SVM) as weak learners, and several SVM learning models are integrated using the AdaBoost framework. In the integrated prediction process, the time attribute of samples has an impact on the update of sample weights in addition to the prediction performance of each model. Multiple temperature change modes have been used to validate the aforementioned procedure.Results and DiscussionsFirst, the temperature drift compensation results of the proposed algorithm are compared with the conventional AdaBoost-SVM algorithm for three transmission gratings in the 2 ℃ narrow changing temperature environment experiment of cooling and heating (Table 3). Secondly, in the 15 ℃ cooling amplitude experiment, the temperature drift compensation results of the proposed algorithm are compared with the traditional AdaBoost-SVM algorithm for three transmission gratings. The experimental results show that the maximum temperature drift compensation error of the traditional AdaBoost-SVM algorithm is 10.83 pm, while the maximum temperature drift compensation error of the AdaBoost-SVM based on time weight is reduced to 7.04 pm. The results show that the classic AdaBoost-SVM algorithm's maximum error is approximately 11.57 pm, whereas the maximum error of the AdaBoost-SVM based on time weight is only approximately 4.05 pm. The strategy suggested in this research, however, outperforms unoptimized machine learning methods in terms of superior stability, stronger reliability, and higher prediction accuracy (Table 4). The aforementioned findings show that the method suggested in this article may successfully determine samples' temporal properties, allowing for more reasonable sample weight allocation, a decrease in model performance fluctuations, and an increase in model accuracy.ConclusionsFirst, the high link between the temperature drift sequence data before and after is thoroughly taken into account in this article. The ratio of new and old samples is altered by applying various new weights at various time points, which makes the distribution of sample weights more logical and enhances the model's performance. The experiment next establishes a nonlinear model between the filter surface temperature and output drift error using the spectral locations of three reference gratings as input features. Experiments are carried out on two datasets with different temperature change patterns, and the results reveal that the first dataset does not fully comply with the more important rule of closer samples in general time series proposed in this article due to the short-term fluctuation of temperature changes, so the performance improvement of the model is not significant; the temperature change in the second dataset demonstrates a monotonic cooling trend with apparent gradients, which is more consistent with the more important principles of closer samples, and the performance gain is more significant. Unlike typical hardware techniques, the method suggested in this paper does not require any additional hardware, resulting in a novel approach to temperature drift compensation of tunable filters. ObjectiveFiber Fabry-Perot tunable filters (FFP-TF) controlled by piezoelectric ceramics are prone to temperature drift in fiber Bragg grating (FBG) sensing systems. During the long-term measurement process, FFP-TF will cause continuous drift of the output wavelength, which will adversely damage the FBG sensing system's measurement accuracy. At the moment, FFP-TF temperature drift compensation primarily entails adding hardware calibration modules to the FBG sensing system, such as the reference grating method, F-P etalon method, gas absorption method, and composite wavelength reference method. Although these technologies can efficiently adjust for temperature drift, they greatly increase the system's cost and complexity. As a result, utilizing software approaches to compensate for temperature drift in FFP-TF is a practical and low-cost method. However, most contemporary temperature drift compensation approaches based on artificial intelligence technologies neglect temperature drift data's temporal features. In fact, the fresh sample has a higher impact on the prediction outcomes of the following data than the old sample. As a result, this work extensively addresses the impact of temporal features on temperature drift compensation when processing temperature drift and other highly time-dependent data. A tunable filter temperature drift compensation approach with time weight is suggested based on the AdaBoost-SVM algorithm and time weight.MethodsWe use FBG0 as the reference grating and the other three FBGs as sensing gratings, and each sensing grating is modeled individually. The temperature-related values of the experimental environment are chosen as the model's input features in this investigation. Furthermore, because the wavelength drift errors of each FBG in the FFP-TF output spectrum have a high correlation, we use the drift of the reference grating as an input feature of the dynamic compensation model to compensate for the lack of accurate temperature information in the F-P cavity. The significant link between the temperature drift sequence data before and after is taken into account in full by this investigation. The idea of time weight is introduced in the process of modeling the temperature drift of FFP-TF to assign various temporal attributes to each sample. After that, temperature drift samples are modeled using support vector machines (SVM) as weak learners, and several SVM learning models are integrated using the AdaBoost framework. In the integrated prediction process, the time attribute of samples has an impact on the update of sample weights in addition to the prediction performance of each model. Multiple temperature change modes have been used to validate the aforementioned procedure.Results and DiscussionsFirst, the temperature drift compensation results of the proposed algorithm are compared with the conventional AdaBoost-SVM algorithm for three transmission gratings in the 2 ℃ narrow changing temperature environment experiment of cooling and heating (Table 3). Secondly, in the 15 ℃ cooling amplitude experiment, the temperature drift compensation results of the proposed algorithm are compared with the traditional AdaBoost-SVM algorithm for three transmission gratings. The experimental results show that the maximum temperature drift compensation error of the traditional AdaBoost-SVM algorithm is 10.83 pm, while the maximum temperature drift compensation error of the AdaBoost-SVM based on time weight is reduced to 7.04 pm. The results show that the classic AdaBoost-SVM algorithm's maximum error is approximately 11.57 pm, whereas the maximum error of the AdaBoost-SVM based on time weight is only approximately 4.05 pm. The strategy suggested in this research, however, outperforms unoptimized machine learning methods in terms of superior stability, stronger reliability, and higher prediction accuracy (Table 4). The aforementioned findings show that the method suggested in this article may successfully determine samples' temporal properties, allowing for more reasonable sample weight allocation, a decrease in model performance fluctuations, and an increase in model accuracy.ConclusionsFirst, the high link between the temperature drift sequence data before and after is thoroughly taken into account in this article. The ratio of new and old samples is altered by applying various new weights at various time points, which makes the distribution of sample weights more logical and enhances the model's performance. The experiment next establishes a nonlinear model between the filter surface temperature and output drift error using the spectral locations of three reference gratings as input features. Experiments are carried out on two datasets with different temperature change patterns, and the results reveal that the first dataset does not fully comply with the more important rule of closer samples in general time series proposed in this article due to the short-term fluctuation of temperature changes, so the performance improvement of the model is not significant; the temperature change in the second dataset demonstrates a monotonic cooling trend with apparent gradients, which is more consistent with the more important principles of closer samples, and the performance gain is more significant. Unlike typical hardware techniques, the method suggested in this paper does not require any additional hardware, resulting in a novel approach to temperature drift compensation of tunable filters.
Acta Optica Sinica
- Publication Date: Nov. 10, 2023
- Vol. 43, Issue 21, 2105001 (2023)
Topics
© Copyright 2018-2021 | Chinese Laser Press. All Rights Reserved 沪ICP备15018463号-20